

Newsletter
Groundbreaking BMT data unveils property trends
Despite interest rate increases, 2023 has been favourable for property investors, with double digit rental increases in most parts of Australia. Recent stability in the vacancy rate indicates that conditions are starting to balance out for tenants in some areas.

In April, rental property availability in Australia hit an all-time low, but has subsequently increased. Despite rental listings still being 33.3 per cent below the long-term average (primarily driven by Sydney and Melbourne), most capital cities are now witnessing an increase in rental listings over the course of the year.
Property investors still maintain a strong proportion in all markets with investor lending making up 33.5 per cent of housing loans as of May 2023, an increase from 32.7 per cent in the previous month.
BMT’s examination of data from completing more than 800,000 depreciation schedules uncovers further significant trends that contribute to the understanding of investor behaviour in the current property market.
Trend 1: Regional areas gather momentum
Regional areas of Australia have caught the attention of property investors for a multitude of reasons, including lower property prices compared to major cities, potential for capital growth, and lifestyle.
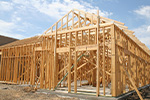
The COVID-19 pandemic and changing work patterns prompted many individuals and families to relocate to regional areas in recent years. This shift led to a burst in demand for housing in regions, which in turn has increased interest from property investors.
BMT’s data supports this, with Table 1 showing a 5.66 per cent increase of regional tax depreciation schedules ordered for investment properties between FY 2019-20 and FY 2022-23 (up to 33.48 per cent from 27.82 per cent).
While this surge of interest has since moderated, government initiatives and infrastructure developments continue to attract property investors to regional areas. Such initiatives include investment in transport infrastructure, healthcare, education, and other amenities aimed at stimulating regional growth. Table 1 shows that demand for tax depreciation schedules in regional areas is slowing but still trending upwards.
Table 1: Capital city vs regional tax depreciation schedules ordered
| Property location | FY 2019-20 | FY 2020-21 | FY 2021-22 | FY 2022-23 |
| Capital city | 72.18% | 68.45% | 67.71% | 66.52% |
| Regional | 27.82% | 31.55% | 32.29% | 33.48% |
Trend 2: Home trumps investment – People spend more on their own turf
The amount an investor will spend on purchasing an investment property compared to a primary place of residence varies, depending upon their financial situation, investment strategy, and market conditions. Generally, people may allocate more of their financial resources towards purchasing or improving their primary residence, considering it as a place to live and create a comfortable living environment for themselves, while investment properties are typically chosen with the goal of generating income or capital appreciation.
This is supported by the BMT data shown in Table 2, which shows data from two years: 2021 (mid-pandemic) and 2023 (post-pandemic). Specifically, it shows that in both years, the mean price of investment properties across almost all states is significantly lower than the mean dwelling price (both owner occupied and investment properties). While almost all prices are rising, the percentage by which dwelling prices have increased is larger than the investment price increase in general. From this data alone, it can be argued that investor-buying isn’t the main contributor to rising dwelling prices.
Table 2: Mean investment property price vs mean dwelling price
| As at March 2021 | As at March 2023 | |||||
| Mean investment property price* |
Mean dwelling price** ($) |
Mean investment property price* |
Mean dwelling price** ($) |
|||
| House ($) | Unit ($) | House ($) | Unit ($) | |||
| NSW | 916,418 | 807,125 | 1,011,100 | 952,115 | 843,643 | 1,150,400 |
| QLD | 621,337 | 550,003 | 586,200 | 642,413 | 555,193 | 752,200 |
| ACT | 758,686 | 494,668 | 809,600 | 812,269 | 527,304 | 951,800 |
| VIC | 712,786 | 596,500 | 834,600 | 769,707 | 602,189 | 898,300 |
| TAS | 508,957 | 390,496 | 528,400 | 593,583 | 431,385 | 655,800 |
| NT | 568,020 | 427,130 | 480,400 | 557,501 | 396,987 | 501,100 |
| SA | 487,702 | 433,696 | 524,000 | 531,494 | 484,282 | 664,300 |
| WA | 589,968 | 508,393 | 582,800 | 541,229 | 465,269 | 651,700 |
*Mean investment property prices are taken from BMT Tax Depreciation schedules for properties where schedule order and property settlement occurred in FY2020-21 and FY2022-23.
**Mean dwelling price according to Australian Bureau of Statistics as of the March 2023 quarter.
Trend 3: Owners converting their homes to investment properties
During the last financial year, there was a noticeable surge in tax depreciation schedules prepared for people who chose to convert their homes into investment properties – marking a reversal from the prior year which fell significantly. There could be several reasons for this.
Low vacancy rates, elevated rental rates, and attractive yields are creating a favourable market, which could be compelling property owners to seize the opportunity and capitalise on the prevailing conditions, converting their primary place of residence into an investment when upgrading, rather than selling.
Table 3: Homes converted to investments
| Year | No. converted |
| FY 2018-19 | 11,666 |
| FY 2019-20 | 11,935 |
| FY 2020-21 | 10,656 |
| FY 2021-22 | 9,233 |
| FY 2022-23 | 11,111 |
Trend 4: Houses reign supreme
Analysis of BMT data reveals a shift in preference from units to houses, with a decline of 7.6 per cent in the number of schedules ordered for units from FY2019-20 to FY2022-23 (Table 4).
The rising demand for work-from-home options and spacious living has driven tenants to seek houses that offer flexible setups, dedicated home offices, outdoor spaces, and proximity to nature. These factors explain the shift in preferences towards houses.
Table 4: House and unit tax depreciation schedules ordered
| Year | House | Unit |
| FY 2019-20 | 51.2% | 48.8% |
| FY 2020-21 | 54.2% | 45.8% |
| FY 2021-22 | 56.5% | 43.5% |
| FY 2022-23 | 58.8% | 41.2% |
Overall, the rental market in Australia is experiencing a period of adjustment and rebalancing, with regional areas gaining momentum and tenants seeking houses with desirable features.